NBA Fans Can Compare Player Stats Through Student-Created Software
NBA coaches and basketball fans alike have a new and simple way of viewing shot comparisons and other statistics thanks to software created by a Georgia Tech Ph.D. student.
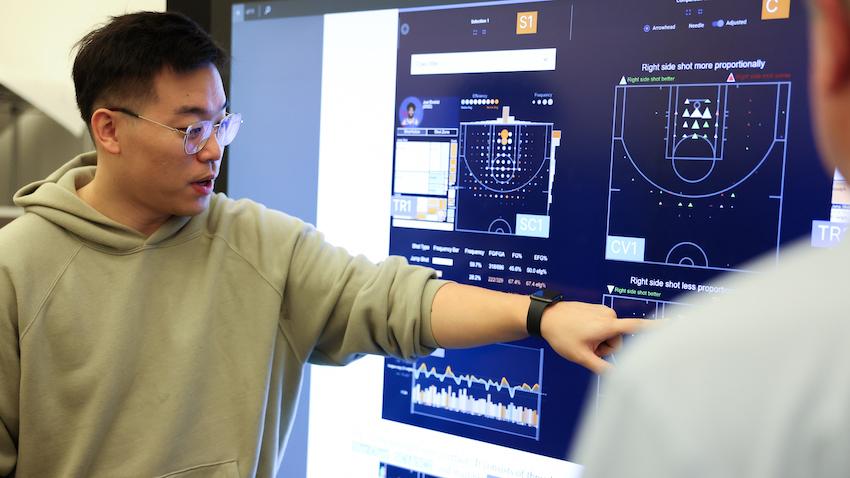
HoopInSight uses data visualization to allow users to compare one player's stats to any other player in the NBA and shows in what areas one player is better than another.
Yu Fu, a former journalist who covered the NBA for a China-based media company, merged his passion for basketball and data visualization when he created HoopInsight. NBA data for every shot taken by every player for the past five years powers HoopInSight.
Fu said that data visualization and analytics in basketball began with the shot map, which tracks where a player takes a shot and how many shots the player takes, revealing their “hot zones.” NBA coaches and staff use the data to create game plans allowing their players to get into their “hot zones.” Opposing teams use the data to prevent those players from getting into those positions.
Since the shot map was introduced, visualization tools have not incorporated an in-depth comparison feature of data and information. That’s what Fu brings to HoopInSight.
HoopInSight can compare shooting stats from Joel Embiid of the Philadelphia 76ers and Nikola Jokic of the Denver Nuggets or any two players. It presents their comparisons in a way that is easy for users to comprehend.
Instead of users looking back and forth between each column of data to make comparisons, HoopInSight provides a comparison view in the middle of the screen. This view immediately tells users which players are shooting better from certain areas.
But that’s just the tip of the iceberg for what HoopInSight can do.

“Rudy Gobert was the best defensive player for the Utah Jazz in the 2021-2022 season,” said Fu, who works in the Information Interfaces Group directed by Regents' Professor John Stasko. “You can see all the shots of Utah’s opponents for the entire season, and I can filter it by when Gobert is off the court and when he’s on the court. I can see their opponents took far fewer shots in the middle of the paint with him on the court, which indicates he’s a very good defender around the rim.”
HoopInSight can also track a team’s performance when certain players are in the game together. For example, Fu can see whether a team’s defensive performance improves when they put an extra forward in the lineup to compete with a team that plays a lot of bigger players.
Fu and Stasko co-authored a paper on HoopInSight that they will present this week at the 2023 Institute of Electrical and Electronics Engineers’ Visualization & Visual Analytics (IEEE VIS) conference in Melbourne, Australia.
Despite his ties to the NBA, Fu said he created HoopInSight as a passion project and is still determining if NBA teams will be interested in incorporating it. While data visualization and are and analytics are helpful, many coaches still rely on what they see during the game to make their decisions.
Fu believes his idea could catch on if he continues simplifying the comparison tool and making it as easy as possible to use for end users..
“There’s a disparity between analytics experts and basketball experts,” Fu said. “The basketball experts tend to use the eye test to know what’s going on and who’s performing well. The analytics experts know more about machine learning and numbers. Visualization plays a role that can bridge these two together.”
To explore the demo version of HoopInSight, visit the Information Interfaces Group website.
Professor Earns IEEE VGTC Lifetime Achievement Award
As computing revolutionizes research in science and engineering disciplines and drives industry innovation, Georgia Tech leads the way, ranking as a top-tier destination for undergraduate computer science (CS) education. Read more about the college's commitment:… https://t.co/9e5udNwuuD pic.twitter.com/MZ6KU9gpF3
— Georgia Tech Computing (@gtcomputing) September 24, 2024


